Advertisement
If you’ve ever felt that a machine learning model isn’t quite “getting it right,” there’s a high chance the issue doesn’t lie in the algorithm—it’s probably the data. Not the volume, not the source, but the quality. That quiet, often skipped-over concept of “data quality” is, in fact, the anchor for everything else that follows in a machine learning pipeline.
So, what exactly does “data quality” mean in the context of machine learning? Let’s take a closer look at the components that shape it and why they matter more than they’re often given credit for.
Data quality isn’t just one thing—it’s a combination of multiple factors. Think of it like the ingredients in a recipe. Each one plays a role, and missing even a single item can throw everything off.

This is probably the first thing that comes to mind. Are the values correct? For supervised learning tasks, especially, accuracy refers to how well the features and labels reflect reality. If your dataset says a dog has wings or a house in New York costs $5, accuracy is clearly out the window.
Mistakes in data entry, poorly labeled classes, or outdated values can disrupt the patterns a model attempts to learn. And the problem doesn’t stay small—flaws in accuracy often ripple across the entire prediction process.
Missing data isn't always a red flag, but large gaps in a dataset definitely are. A few blank fields here and there might be manageable, especially if handled well during preprocessing. But a model that relies heavily on information that’s mostly absent won’t learn much.
For instance, imagine training a healthcare model without consistent patient vitals or a recommendation system with half the user reviews missing. The insight just isn’t there.
Let’s say one entry says "NY," another says "New York," and a third spells it "N.Y." Technically, they refer to the same place, but if not treated uniformly, a machine can’t make that connection. Inconsistencies make it harder to spot patterns and often create artificial variance that skews model output.
It’s not just naming, either. Date formats, measurement units, even boolean values (yes/no, 1/0, true/false)—all of these have to align. Without standard formatting, datasets introduce irregularities that degrade output quality.
Data isn’t evergreen. What was relevant a year ago might be outdated today. A model predicting real estate trends in 2025 using prices from 2017? That’s going to be off. Timeliness measures how current the data is and whether it reflects present-day patterns.
This factor matters a lot in fields like finance, social behavior, or e-commerce—areas where the environment shifts often. Without timely input, the results drift farther from real-world application.
It’s easy to treat data quality as something that gets “fixed” before the model training begins. But that mindset misses the point. Data quality plays an active role beyond the prep stage—it’s linked to how a model behaves, adapts, and performs under changing conditions.
When the training data accurately mirrors the problem domain, models become more adaptable to real-world inputs. They can handle moderate change without confusion, and they're less prone to erratic behavior as the system matures.
This kind of durability matters in production environments. Stability saves engineering time, reduces regression testing, and allows teams to focus on improving logic instead of fixing strange side effects.
Low-quality data stretches time and budget. When the model keeps analyzing noise or correcting misaligned labels, every iteration demands more computing power and development effort. Instead of progressing, teams spend cycles retracing steps to clean up behind the model.
In contrast, quality data allows algorithms to extract meaning without added overhead. Fewer experiments fail due to anomalies, and cleaner signals reduce the time spent chasing false improvements.
Many machine learning systems retrain over time with new incoming data. A weak foundation can compound existing flaws during each update. Over time, a once-accurate model may drift into inaccuracy, not because of external change, but due to degraded inputs.
When your base data holds strong, future updates carry fewer hidden risks. You can allow automation to do more of the retraining work, knowing the underlying signal remains consistent.
Understanding what data quality means is one thing. Actually measuring it is another. This is where things get practical. Because if you can’t see the flaws in your data, you can’t fix them.
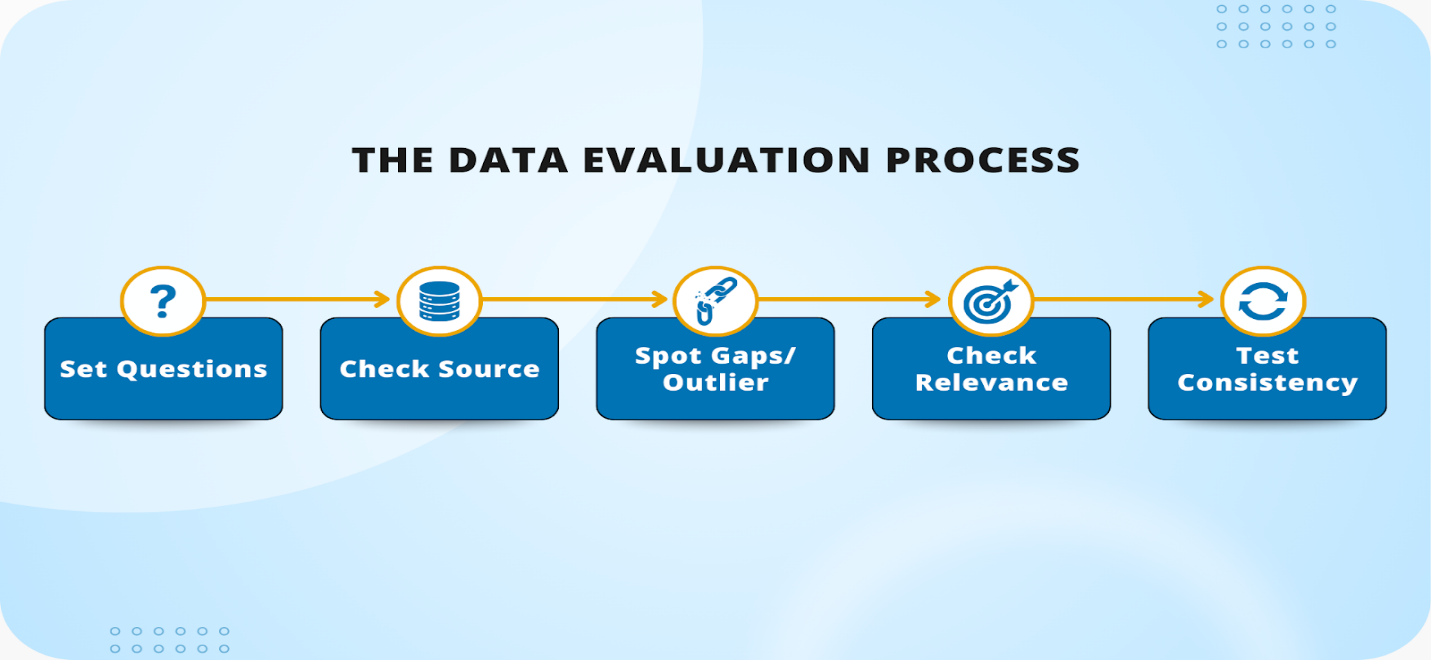
Start by profiling your dataset. This means looking at distributions, missing values, outliers, and basic statistics. It’s like getting a health checkup before starting a new training regimen.
Use profiling tools that can automatically surface issues. Many data science platforms include these by default, and open-source libraries like pandas-profiling and great_expectations are especially handy.
Accuracy can be cross-checked. If you're working with public data, try comparing parts of it with other datasets or benchmarks. Even spot checks help. The goal is to ensure that what's in your dataset lines up with what's true in the real world.
This step also involves validating labels, especially if they were hand-annotated or generated through crowdsourcing. A small error in labeling breeds confusion that models struggle to interpret.
Not every dataset comes with rules, but you can (and should) define some. For example, a temperature field shouldn’t have negative values for a dataset based on oven usage. An age field shouldn’t say 200. These seem obvious, but such edge cases creep in more often than you’d expect.
Define your boundaries, stick to them, and log every time a record breaks them. This ensures your pipeline catches issues before they make their way into training data.
Once your data pipeline is live, the story doesn’t end. Use drift detection to track changes in incoming data. Are values staying within expected ranges? Are new patterns emerging that the model hasn’t seen before?
Keeping an eye on drift helps you adjust the model—or the data—before things start going sideways in production. It’s an early signal that your assumptions might need recalibration.
Data quality might not get the spotlight, but it plays a defining role in whether machine learning succeeds or stalls. The cleaner the input, the more reliable the output—and the fewer surprises you’ll face along the way.
So, the next time a model produces questionable results, don't immediately dive into tweaking algorithms or adding more layers. Start by checking what went in. That's usually where the answer is to be found.
Bottom of Form
Advertisement
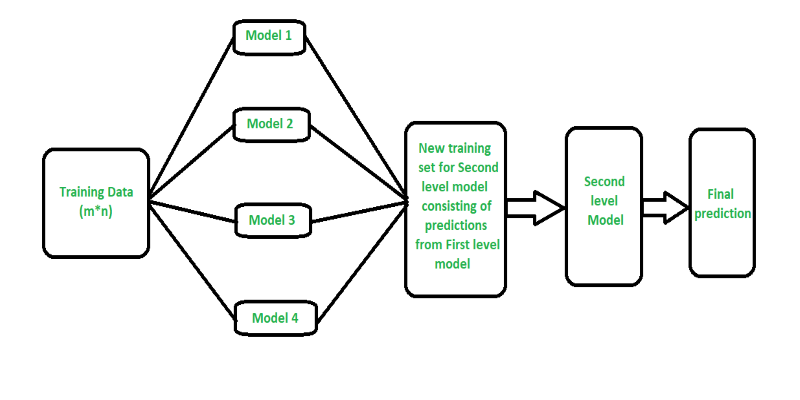
Curious how stacking boosts model performance? Learn how diverse algorithms work together in layered combinations to improve accuracy—and why stacking goes beyond typical ensemble methods
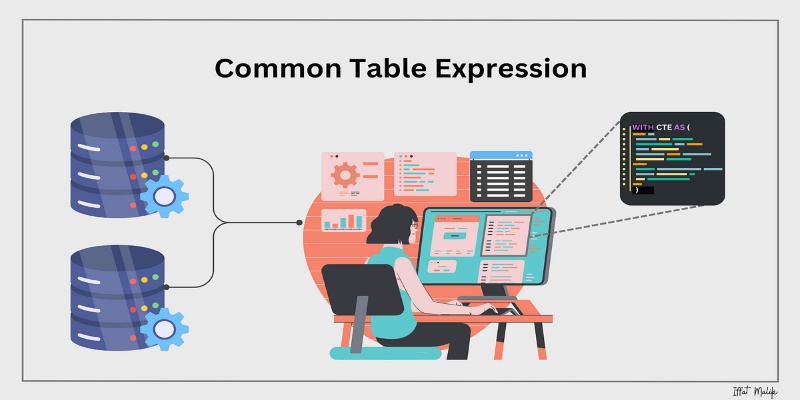
Learn what a Common Table Expression (CTE) is, why it improves SQL query readability and reusability, and how to use it effectively—including recursive CTEs for hierarchical data

Looking for practical data science tools? Explore ten standout GitHub repositories—from algorithms and frameworks to real-world projects—that help you build, learn, and grow faster in ML

A detailed look at training CodeParrot from scratch, including dataset selection, model architecture, and its role as a Python-focused code generation model

How to convert transformers to ONNX with Hugging Face Optimum to speed up inference, reduce memory usage, and make your models easier to deploy across platforms
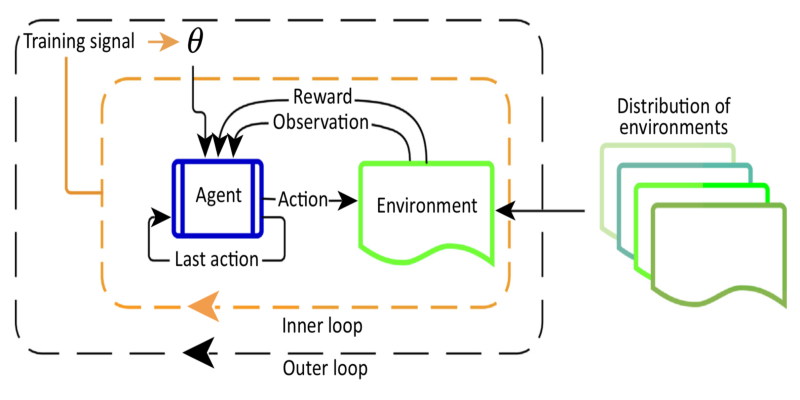
Curious about Meta-RL? Learn how meta-reinforcement learning helps data science systems adapt faster, use fewer samples, and evolve smarter—without retraining from scratch every time

Learn how Apache Oozie coordinates Hadoop jobs with XML workflows, time-based triggers, and clean orchestration. Ideal for production-ready data pipelines and complex ETL chains

Confused about the difference between a data lake and a data warehouse? Discover how they compare, where each shines, and how to choose the right one for your team

Discover lesser-known Pandas functions that can improve your data manipulation skills in 2025, from query() for cleaner filtering to explode() for flattening lists in columns

How fine-tuning CLIP with satellite data improves its performance in interpreting remote sensing images and captions for tasks like land use mapping and disaster monitoring
Explore how Neo4j uses graph structures to efficiently model relationships in social networks, fraud detection, recommendation systems, and IT operations—plus a practical setup guide

How Stable Diffusion in JAX improves speed, scalability, and reproducibility. Learn how it compares to PyTorch and why Flax diffusion models are gaining traction